This post records all the confusion matrixes and ROC-AUC curves we collected testing six datasets with the distlBERT model. Also with the additional explanations.
Ethnic Group:
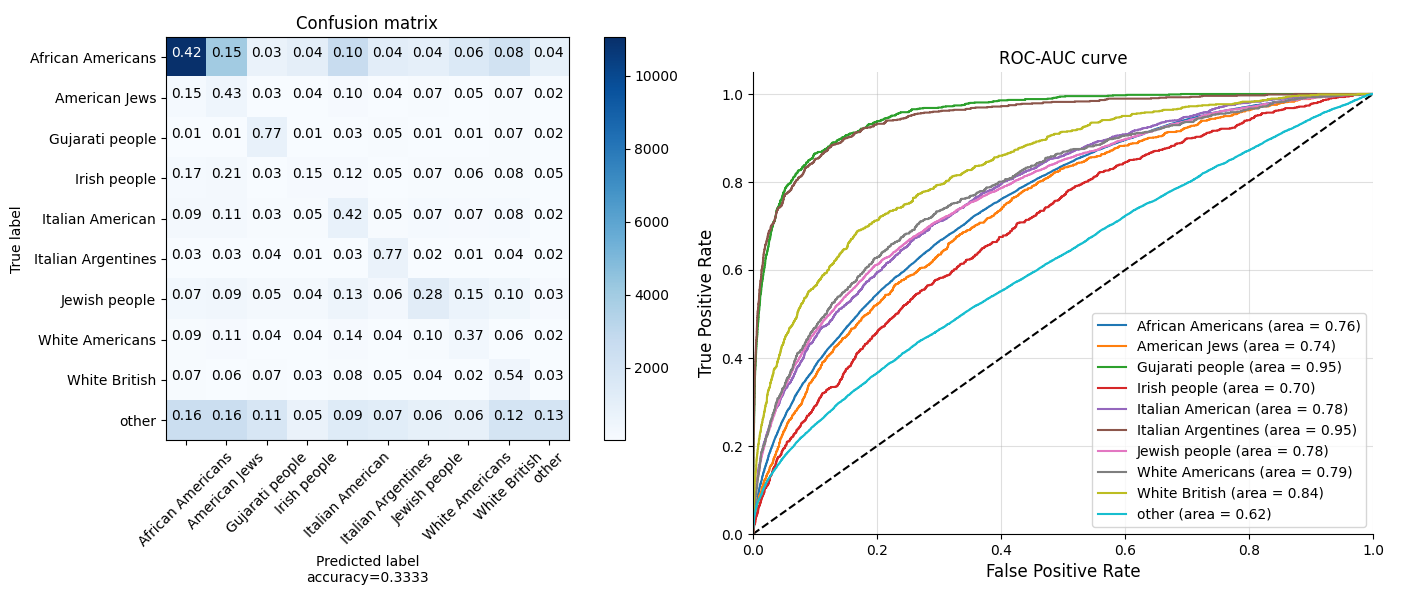
As mentioned in the home page, the Gujarati people and Italian Argentines get the highest true positive rate and accuracy. While African Americans has the most samples.
Date of Birth
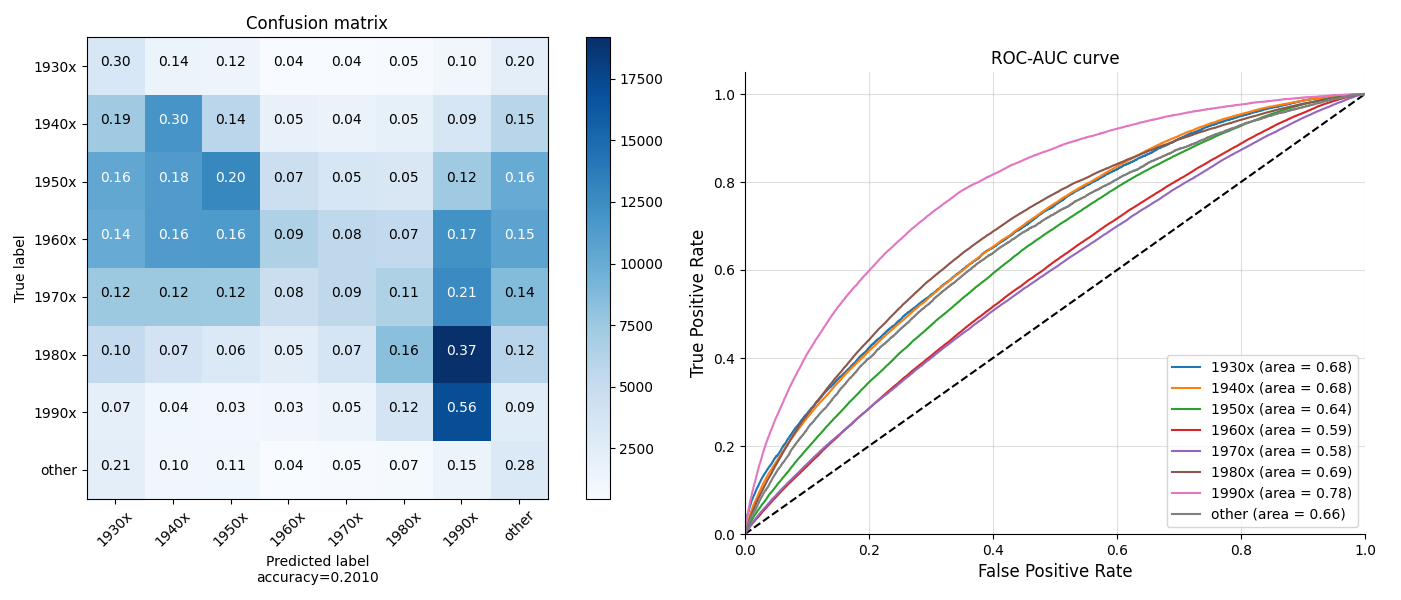
Quotations of the people born in 1990s gets the highest true positive rate and accuracy. Also, as shown in the 7th row of the Matrix, most of people born in 1980s are indentified as 1990s.
Religion
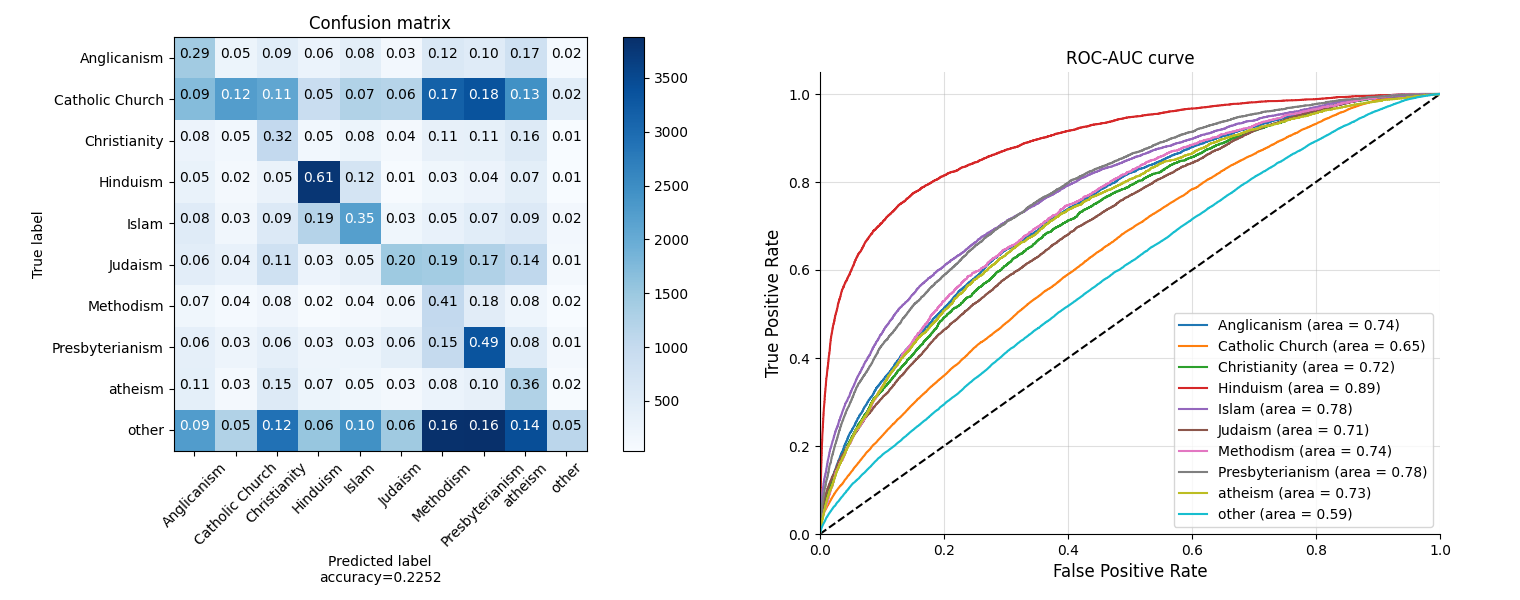
The speakers in Hinduism get the highest true positive rate and accuracy, and also the most number of samples in the dataset. Then follows Presbyterianism and Islam . It seems for the Religion feature, the performance of our model has positive correlation with the number of the samples.
Gender
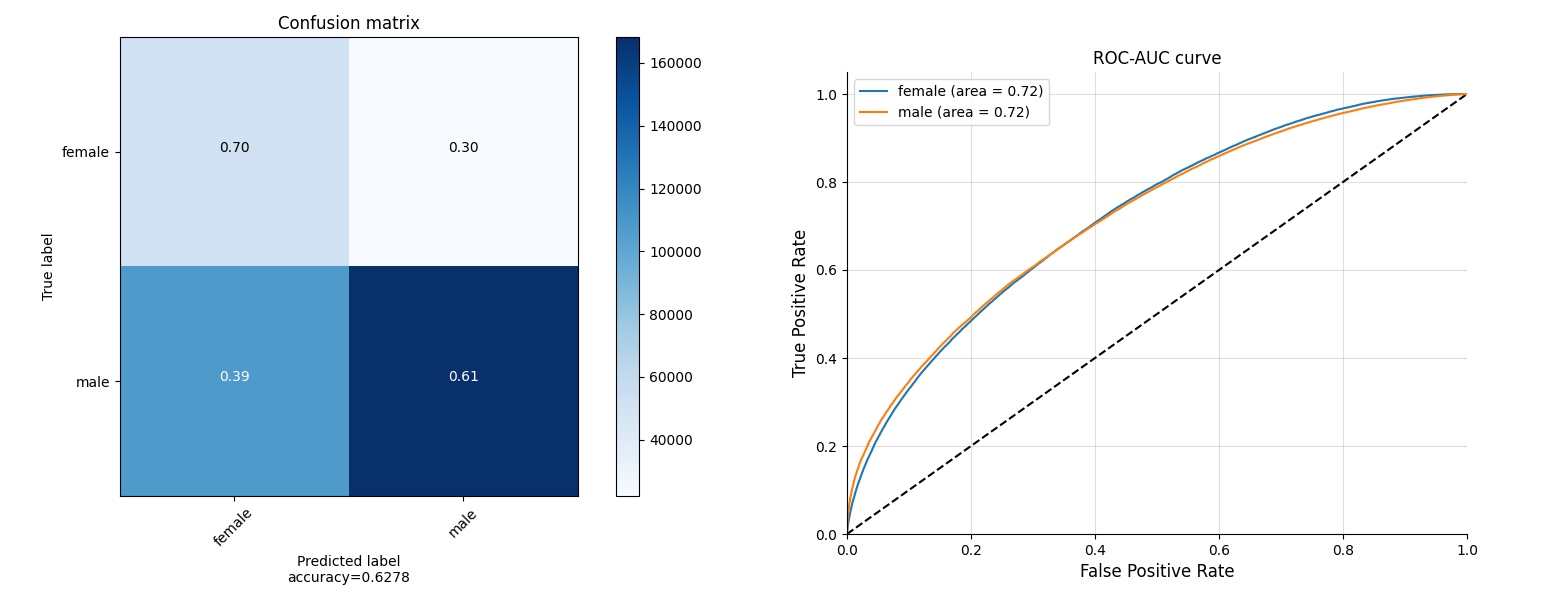
The male and female have the similar ROC-AUC curves, while the model predicts most part of females’ quotations as from males. We suppose this due to the imbalance of samples number between males and females.
Occupation
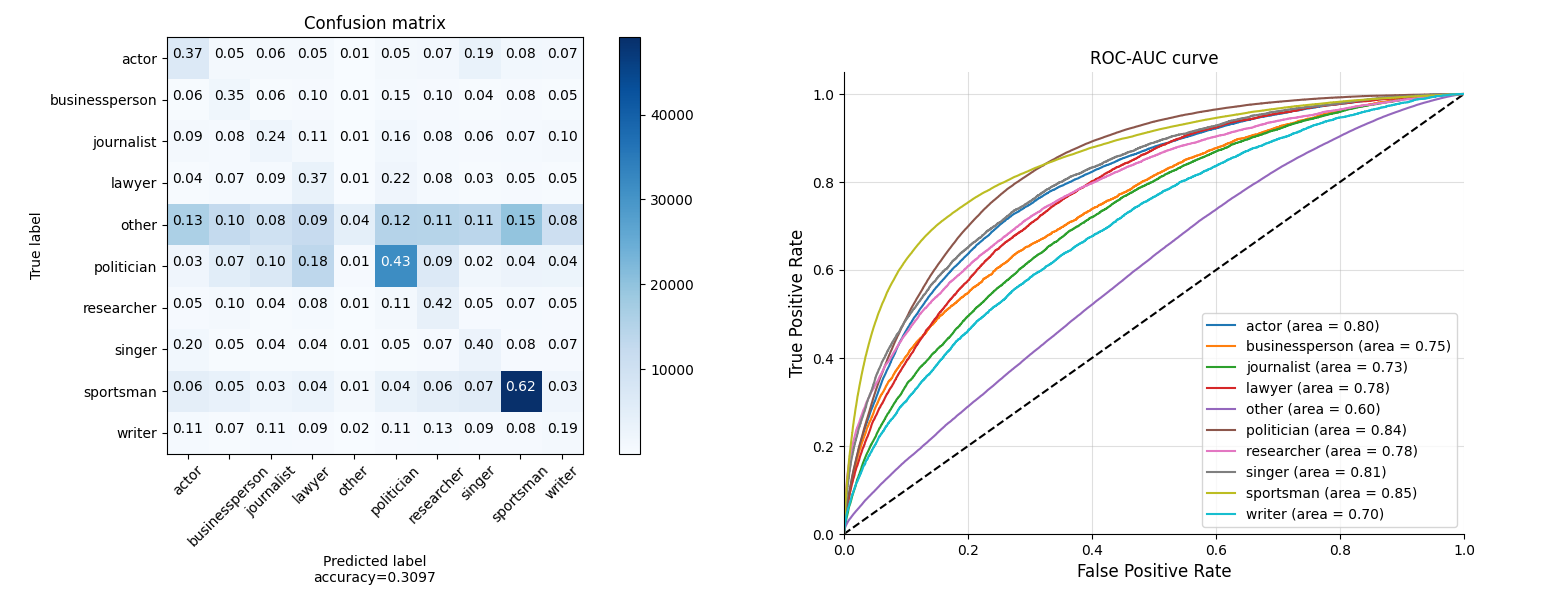
For the occupation, the sportsman and policians have most sample numbers and the model has the best perfomance on them.
Nationality
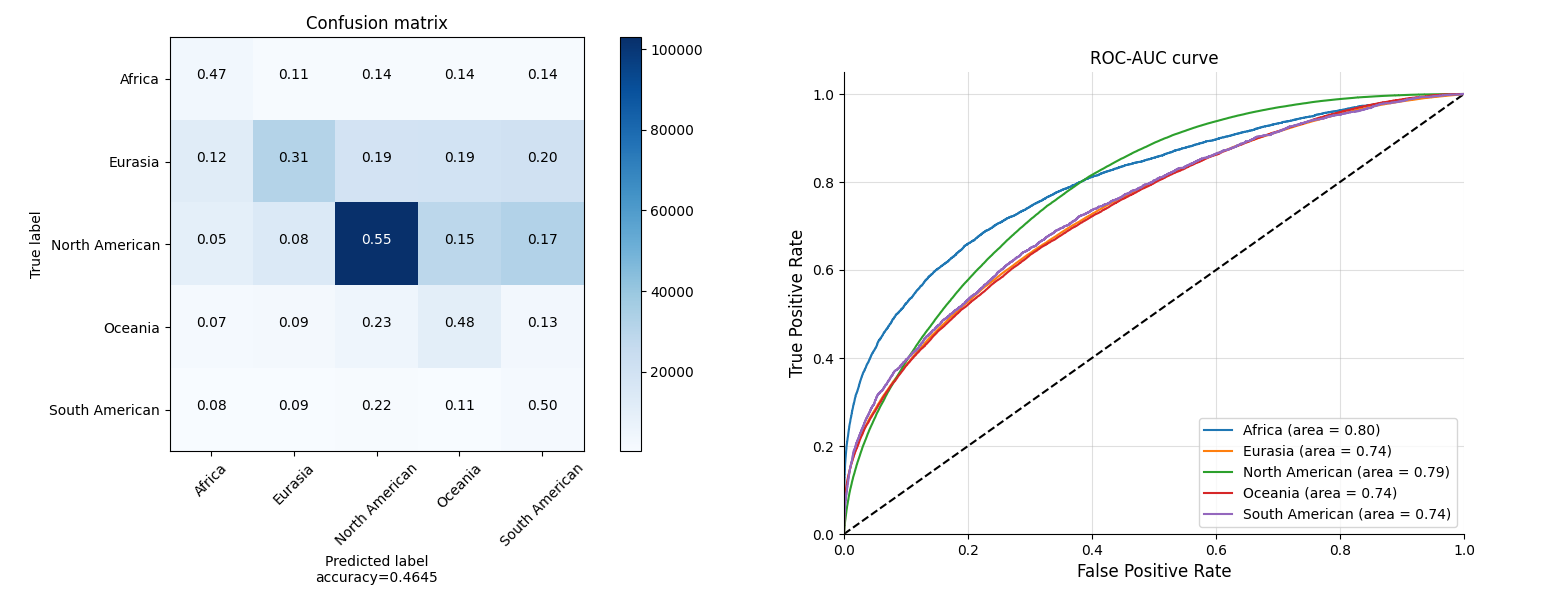
For the nationality, North American has the most samples and model performs best on it. However, Oceania and South American have the less samples but better accuracy than Eurasia. And Eurasia is easy to be recoginized as the other three nationalities mentioned above.